Streaming operators everywhere are paying for growth they never priced. Here is what the bill is really telling you — and the five decisions that change it.
The short version
1. In broadcast, reach was almost free. In streaming, every viewer costs money — every session, every device, every hour watched.
2. Mid-market operators pay the most for that shift: list prices, locked contracts and no benchmark to argue with.
3. The spend is not created by engineers. It is created upstream, by decisions about rights, formats and launch promises.
4. One ceiling makes it visible: all infrastructure at or below 5% of revenue.
5. Five traps produce the overspend. Each has a counter-move — and each move needs one named owner.
The shift — when delivery became part of the business
In broadcast, scale was almost free. In streaming, every viewer has a cost.
For decades, cable, satellite and terrestrial television ran on one comfortable idea: delivery was solved. One signal could reach one home or ten million homes for roughly the same cost. The infrastructure was standard, the products were familiar, and scale was not the constraint. You won on content and distribution deals — not on engineering.
Streaming changed the medium, and then it changed the economics. A viewer is no longer only part of an audience. Each viewer opens a session someone has to deliver. Each new device family needs another version of the file. Each hour watched is metered. Once delivery moved onto the internet, technology stopped being a back-office concern. It became part of the business model — and most media accounts have not caught up.
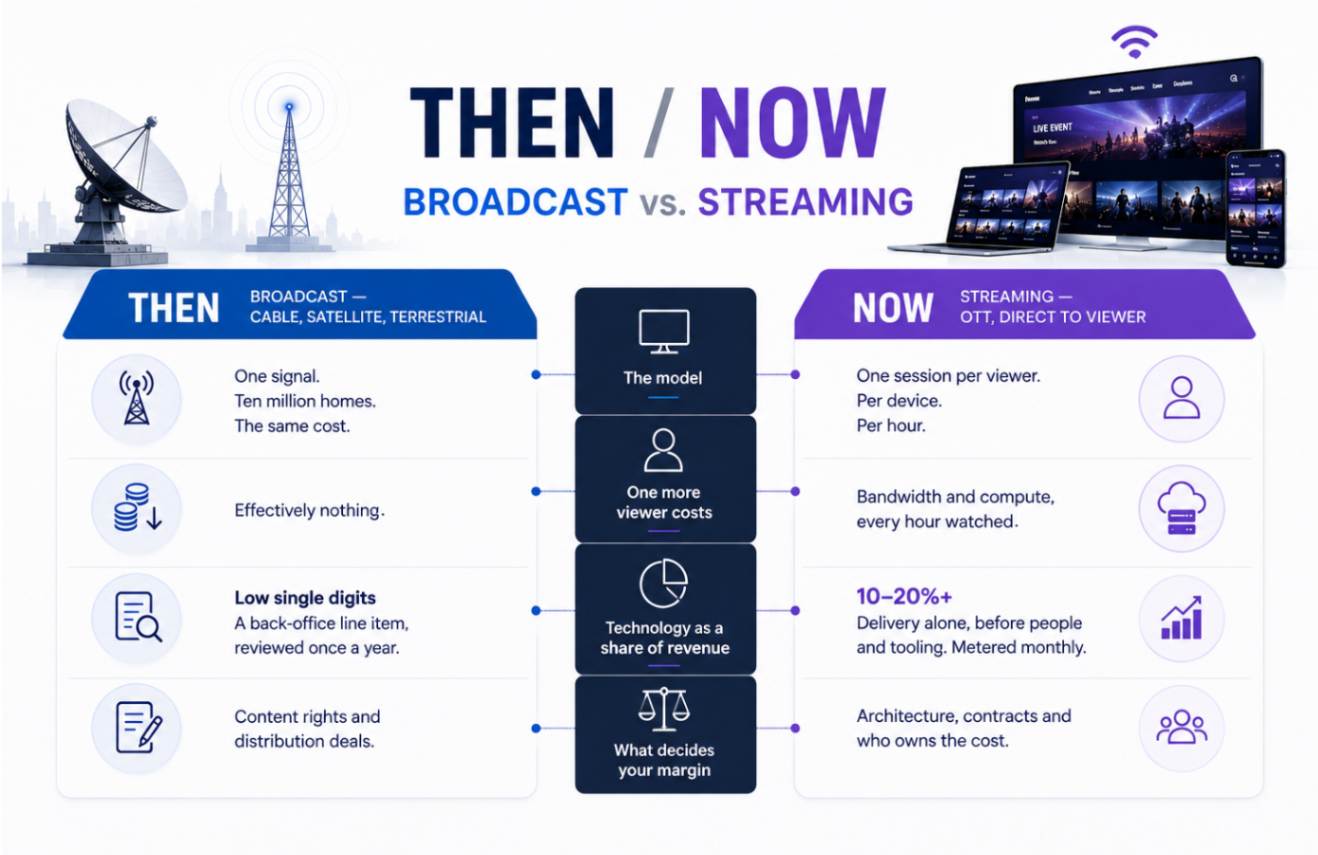
| Then / now | Broadcast — cable, satellite, terrestrial | Streaming — OTT, direct to viewer |
| The model | One signal. Ten million homes. The same cost. | One session per viewer. Per device. Per hour. |
| One more viewer costs | Effectively nothing | Bandwidth and compute, every hour watched |
| Technology as a share of revenue | Low single digits A back-office line item, reviewed once a year. | 10–20%+ Delivery alone, before people and tooling. Metered monthly. |
| What decides your margin | Content rights and distribution deals. | Architecture, contracts and who owns the cost. |
The gap between those two columns is the whole problem. The 5% Rule is what closes it: all infrastructure at or below 5% of revenue.
Broadcast technology spend is given as a range from operating experience, not a published benchmark; the streaming range is the delivery line observed at $10M–$500M scale.
This is not a story about one market. Whether you report in dollars, euros, rupees or reais, the arithmetic is the same: revenue per user grows in steps, while delivery cost grows with every stream.
Netflix is a useful reference point, and an unfair one. Its total technology cost — people, platform and delivery together — is roughly 10% of revenue, per its FY2025 annual filing: 7–9% reported for technology and development, plus an estimated ~3% for delivery. It also has scale, elite engineers and pricing power that almost nobody else has. For operators between $10M and $500M in revenue, the delivery line alone can quietly take 10–20% of revenue, or more. Three forces usually explain why.
No leverage You pay list price Big clouds negotiate with giants. Mid-market operators sign the rate card — and a multi-year deal then locks it in. | No specialists Nobody’s job is to lower it The best cost engineers work at the giants. Your team is measured on keeping the service up, not on making it cheaper. | No benchmark You cannot see “good” No published number says what delivery should cost. Without a target, any invoice can be made to look reasonable. |
Where the money actually goes
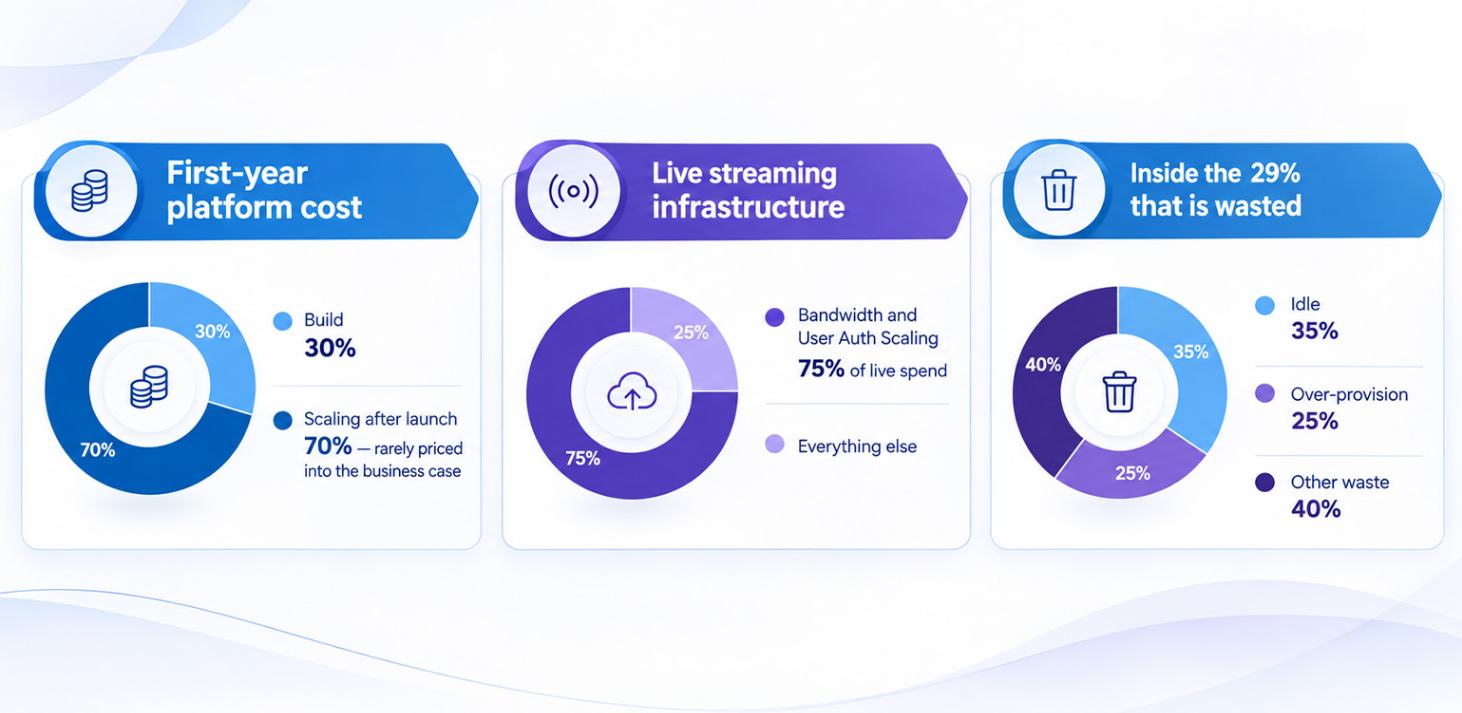
First-year platform cost
| Build 30% | Scaling after launch 70% — rarely priced into the business case |
Live streaming infrastructure
| Bandwidth and User Auth Scaling 75% of live spend | Everything else |
Inside the 29% that is wasted
| Idle 35% | Over-provisioned 25% | Other waste 40% |
First-year split and waste proportions from published industry research (Flexera, 2026; industry cost analyses). The live-infrastructure share — bandwidth plus user authentication and scaling systems — reflects the author's operating experience. The shape repeats across markets and operator sizes.
The cause — why it never gets fixed
Follow the incentives, not the invoices.
The cost does not begin in the server room. It begins in business decisions. A licensing deal can multiply storage before anyone watches a frame. A 4K upgrade can re-price the entire back catalogue — I approved one myself, and underestimated what it would do to the bill. A rights acquisition has to survive your biggest possible night. Those decisions then harden into commitments: a platform built around a single cloud, and contracts signed for years that nobody can easily reopen.
Meanwhile, the people closest to the spend are measured on uptime and launch dates. Almost nobody in that chain is accountable for revenue or margin. That is not an engineering gap. It is a governance gap.
Who is in the room
| Who | Measured on | Cannot see |
| Platform & engineering | Uptime, latency, launch dates | What the same workload costs elsewhere |
| Product | Features shipped, engagement | The delivery cost a feature creates |
| Finance | Total spend against budget | Which upstream decision created the line |
| Leadership | Growth, subscribers, content wins | Whether that growth is profitable per hour streamed |
Everyone here is doing their job. The cost lives in the space between the jobs.
The five traps
| 01 | Married to one cloud The platform was built around one provider’s proprietary services. Moving would mean a rewrite nobody will fund, so price stops being negotiable. |
| 02 | Locked in for years Multi-year commitments were signed on optimistic forecasts. The business changed; the contract did not. No repricing, no change of scope, no exit. |
| 03 | No measure touches revenue Nothing internally connects technology spend to revenue or profit. The bill grows, and nobody’s number moves. |
| 04 | Nothing is ever deleted Every format upgrade copies the library, and old versions never retire. The catalogue grows — and leaving gets more expensive every year. |
| 05 | Frozen at launch, padded for safety The architecture is sized for a smaller business, then padded for peaks. Because overspending rarely costs anyone their job, the padding becomes permanent. |
The standard — put a number on “good”
The 5% Rule
Total infrastructure — content delivery, storage, video processing, cloud services and tooling combined — should stay at or below 5% of revenue. To my knowledge, no analyst publishes that number — which is part of the problem. It comes from years of running these workloads and seeing what is achievable at mid-market scale. The levers are well understood. If you are above the line, you do not only have a technology problem. You have a business-model problem.
Because it is a share of revenue, the rule travels. It works in any currency, in any country, at any size.
≤ 5% of revenue — the ceiling for all infrastructure at mid-market scale. | 29% of all cloud spend is wasted — rising for the first time in five years. About $182B worldwide (Flexera, 2026 State of the Cloud Report). | 30–60% savings documented on predictable workloads in industry cost analyses. The money is recoverable. |
Three ways to spend on delivery
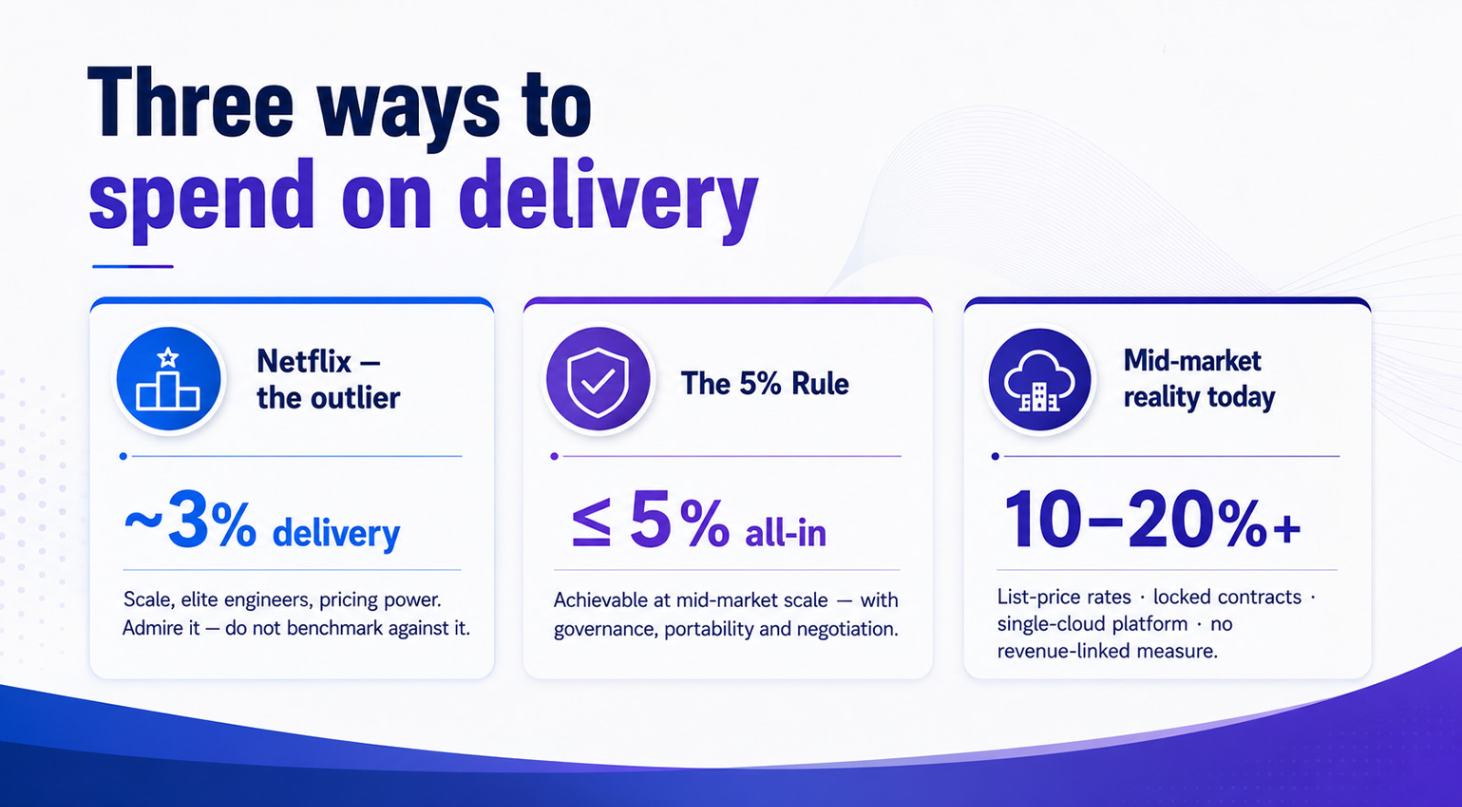
Netflix — the outlier
| ~3% delivery |
Scale, elite engineers, pricing power. Admire it — do not benchmark against it.
The 5% Rule
| ≤ 5% all-in |
Achievable at mid-market scale — with governance, portability and negotiation.
Mid-market reality today
| 10–20%+ |
List-price rates · locked contracts · single-cloud platform · no revenue-linked measure.
The fix — every trap has a counter-move
Five traps. Five moves.
The answer is not another dashboard. It is clear ownership. Each move below is designed to remove one specific trap.
Trap 01 Married to one cloud Cannot move, cannot negotiate. | Move Architect for exit Keep components portable and cloud-neutral. A credible ability to leave is the only leverage a mid-market operator has. |
Trap 02 Locked in for years Paying for the plan, not the business. | Move Buy through scale, not alone Route spend through a partner already buying at volume. You get scale pricing without carrying the multi-year exposure yourself. |
Trap 03 No measure touches revenue Cost grows, nobody’s number moves. | Move Give every technology leader a margin metric Infrastructure as a share of revenue is the simplest one. Put cost per title and cost per hour streamed on the leadership agenda. |
Trap 04 Nothing is ever deleted Storage compounds quietly. | Move Let performance decide what you keep Move or retire content nobody watches automatically, by policy — not by an annual clean-up nobody has time for. |
Trap 05 Frozen at launch, padded for safety Yesterday’s map, peak capacity, 365 days a year. | Move Re-bid delivery, pay for peaks only Use more than one delivery network, price by region, and renegotiate against real traffic. Let events burst into elastic capacity, then release it. Size for demand, not for fear. |
None of this is theory. It comes from years of running streaming platforms, live events and the operations behind them — and from watching many other operators do the same. The playbook does not need a new vendor. It needs one owner.
What good looks like
Four numbers for your next leadership review
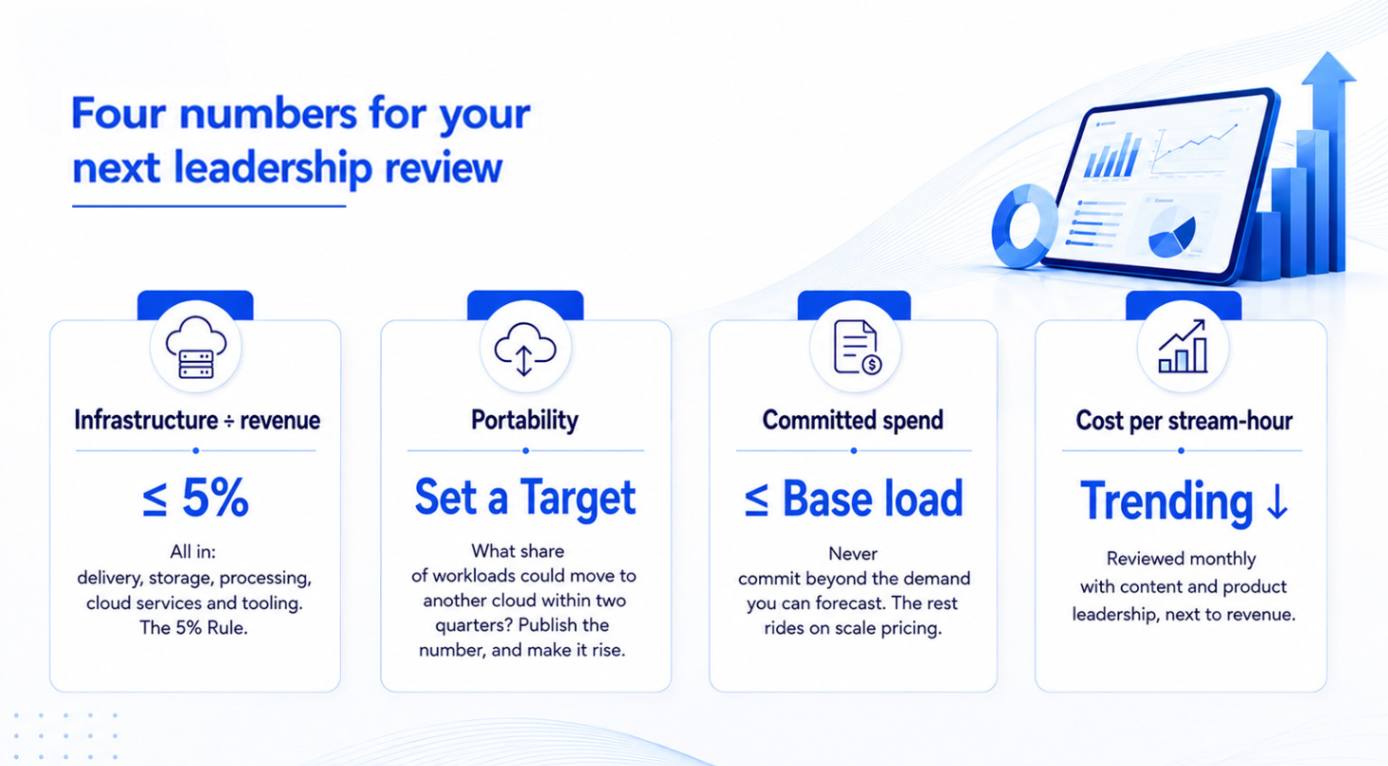
Infrastructure ÷ revenue ≤ 5% All in: delivery, storage, processing, cloud services and tooling. The 5% Rule. | Portability Set a Target What share of workloads could move to another cloud within two quarters? Publish the number, and make it rise. |
Committed spend ≤ Base load Never commit beyond the demand you can forecast. The rest rides on scale pricing. | Cost per stream-hour Trending ↓ Reviewed monthly with content and product leadership, next to revenue. |
If your team cannot produce these four numbers this quarter, that is not a reporting problem. That is the finding.
The takeaway Growth is no longer the risk. Margin is. Streaming is on track to pass $500B before 2030, and video already accounts for more than 65% of internet traffic. The cloud bill keeps arriving as a surprise because it was never priced into the business model. Ask who owns infrastructure as a share of revenue. If the answer is nobody, you have found the problem. |